
Last week we reported that, depending on assetsize distribution, net interest margins (NIMs) were making gradual headway with help from the Fed’s rate hikes over the past two years. As we look forward to a quarter point increase next month (Sept. 26th) let’s delve into that a little deeper.
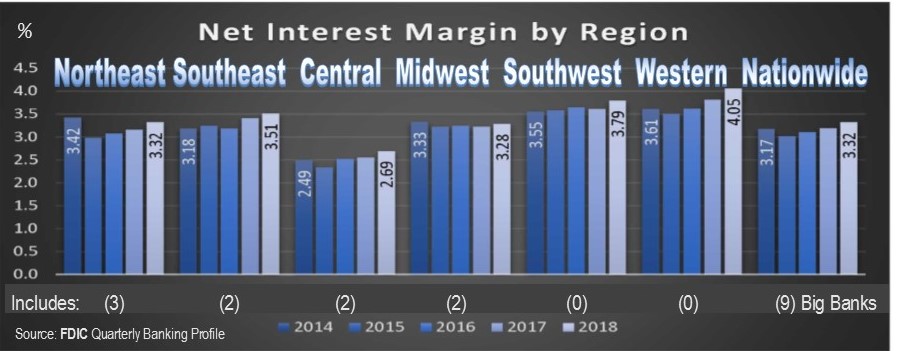
Last week we intentionally left Big Banks out of the discussion. The business model for these behemoths is very different from that of community banks, which is our primary focus. But this week we left them in. As a group, the nine banks with more than $250 billion in assets each (for a total of almost $9 trillion) boast (sic) the lowest NIM of any asset size group at just 2.88%. They are included in this week’s graph (below) which compares NIM by region.
As a whole, net interest margins have been improving over the past couple of years and, with continued help from the Federal Reserve, they will keep doing so. The region that really needs the help is Chicago (aka Central), which has the third largest number of banks. It includes Illinois, Indiana, Kentucky, Michigan, Ohio and Wisconsin and is also home to two Big Banks: JPMorgan Chase and U.S. Bank, both headquartered in Ohio. This is the only region with an average NIM still under 3%.
In sharp contrast, the Western (or San Francisco) area is the smallest by volume, home to just 419 banks, even though it contains 11 states and the U.S. Pacific Islands. Its average NIM is the highest in the nation at 4.05% and it’s easy to see why: it houses none of the behemoth banks and four of the nation’s 11 Credit Card Banks. The Chicago region has no credit card banks, which, by themselves, boast an average NIM of 10.89%.
Regardless of regional trends, however, there are banks all over the country that are taking full advantage of NIM. In fact, 148 can be found in this issue. The banks listed on page 7, and continuing to the supplement are all “community banks” that, in Bauer’s view, have managed to find the sweetest of lending spots. They each have a loan to deposit ratio between 77% and 93%; and a NIM of 4.75% or greater.
Typically, a loan to deposit ratio of 80% to 90% is considered optimal. But, since business models vary from bank to bank, we expanded the range to include 3 basis points on either side. This indicates the banks are lending sufficiently for their size, but not so much that their ability to meet other obligations would be compromised if market conditions took a turn for the worse. So we know these banks are all lending in the desired range. That’s step one.
The next step is that their earning assets are doing what they are supposed to do: earning. Realistically, anything over the national NIM of 3.32% is very good. These banks all exceed that average handily.
You’ll notice that most of the banks on the list are well-rated by Bauer, but not all. That’s because Bauer’s ratings take into account the entire financial picture of the institution. Providence Bank, Alpharetta, GA, for example, has achieved this sweet lending spot putting it at #38 on this list. It is also Well-Capitalized. Yet, its rating is just 1-Star. Why? 1) Asset Quality. Even though improving, its ratio of nonperforming assets to total assets is greater than 9%. 2) Its Efficiency Ratio is 105% (i.e. it takes $105 to earn $100). And 3) it’s Losing Money. For those wanting more information on any bank or credit union, the Analytical Report and Due Diligence Performance Report are sure to fill in the gaps. (Follow links for samples.)