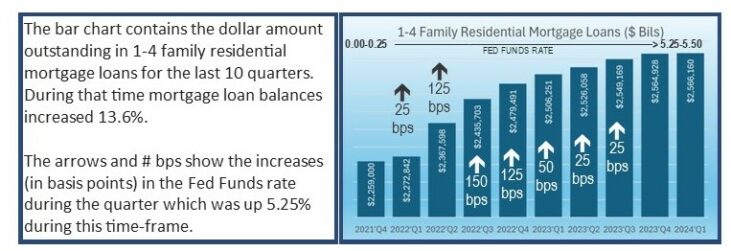
Increasing the Fed Funds Rate 5.25% in a 16-month period was quite a shock to the housing market, especially after being near zero since March 2020.
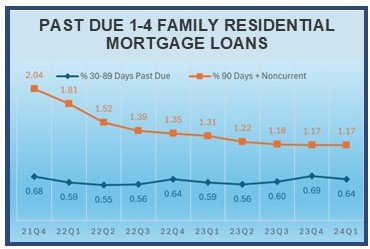
As of this writing, the Fed Funds rate has held steady for 11 solid months, and we can see the normalization occurring. As a rule, the quality of those 1-4 family residential loans has been improving in recent quarters.
That improvement varies wildly by geographic region. The 51 banks listed in this week’s issue of Jumbo Rate News demonstrate those variations.
The Housing Situation is “Complicated”
Those were the words of Federal Reserve Chairman, Jay Powell, right before he said, “the best thing we can do for the housing market is to bring inflation down so that we can bring rates down, so that the housing market can continue to normalize.”
He has received a lot of criticism for that statement, but he’s not wrong. At least he’s not wrong now. Perhaps he was wrong when he increased the Fed Funds Rate 5.25% in a 16-month period (see chart below). That was quite a shock to the housing market, especially after being near zero since March 2020.
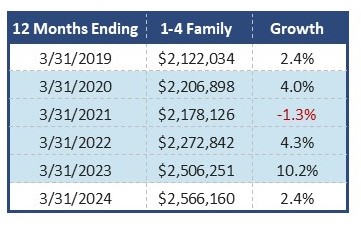
As of this writing, the Fed Funds rate has held steady for 11 solid months, and we can see the normalization occurring. The 2.4% growth during the twelve month period ending March 31, 2019 (pre-COVID) is the same as the 2.4% growth during the twelve months ending March 31, 2024 (although it varied wildly in the years between).

The latest Beige Book survey covered the period from Early April to Mid-May (just after the close of the first quarter). Participants reported that tight credit standards and high interest rates were continuing to constrain loan growth but that housing demand and construction had both risen some.
Nationwide, the quality of those 1-4 family residential loans has been improving in recent quarters. On page 2, we will show you where past due 1-4 family loans are improving the most (and least).

The 51 banks listed on page 5 have three things in common:
1) they are rated less than 5-Stars;
2) Residential real estate accounts for at least 45% of total loans; and
3) Delinquent residential real estate loans exceed 1.8% of the total.
The chart below depicts how noncurrent loans have decreased over the past two years, but also shows that the Dallas region has been continually underperforming all others. However, it is not necessarily obvious which states are included in the Dallas region. One might expect Tennessee, for example, to be in the Atlanta region. It is not; it’s in Dallas.

San Francisco is (and has been) outperforming all other regions. Only one bank from the San Francisco region is represented on page 5. These are the FDIC regions and are the same that we use for the map on page 6 of JRN.
However, had we used the 12 Federal Reserve regions instead of the six FDIC regions, Boston would have been the best performing. There are no New England banks listed on page 5. The FDIC lumps Boston and New York together, but as you can see, these two regions can behave very differently.

